
A Claude Code agent run looks like one request from the outside.
In practice, it may contain model calls, cache hits, tool callbacks, routed sub-agents, retries, file reads, image inspection, branch LLM calls, and final synthesis. The final answer is only the receipt. The useful debugging object is the run path.
That is what a Token Bill of Materials is:
Token BOM = the per-run breakdown of model calls, input tokens, output tokens,
cache-hit tokens, tool callbacks, latency, failure status, and routed work.
For AI agents, the final answer is not enough. You need to know where the tokens went.
Why Claude Code agents need a Token BOM
Coding agents are no longer simple chat sessions. A single request can trigger:
- a planning step
- file search and file reads
- tool calls
- branch model calls
- image or UI inspection
- retries and fallbacks
- final answer synthesis
If you only inspect the final response, you cannot answer the important questions:
Which model spent the tokens?
Which tool call caused the spike?
Was the request slow because of the model, the tool, or the route?
Did a cheap model handle the simple part?
Did a strong model only run where it was needed?
Was the failed step visible, or hidden inside the agent run?
1flowbase turns the agent run into an inspectable workflow-backed virtual model endpoint. Claude Code, Codex, Cursor, OpenCode, Cline, Continue, LibreChat, or an SDK can still call one model endpoint. Behind that endpoint, 1flowbase records the execution path.
The run list is the first BOM view
The log table shows every run with total tokens, input tokens, output tokens, cache-hit tokens, cache hit rate, update time, and a link to the run details.
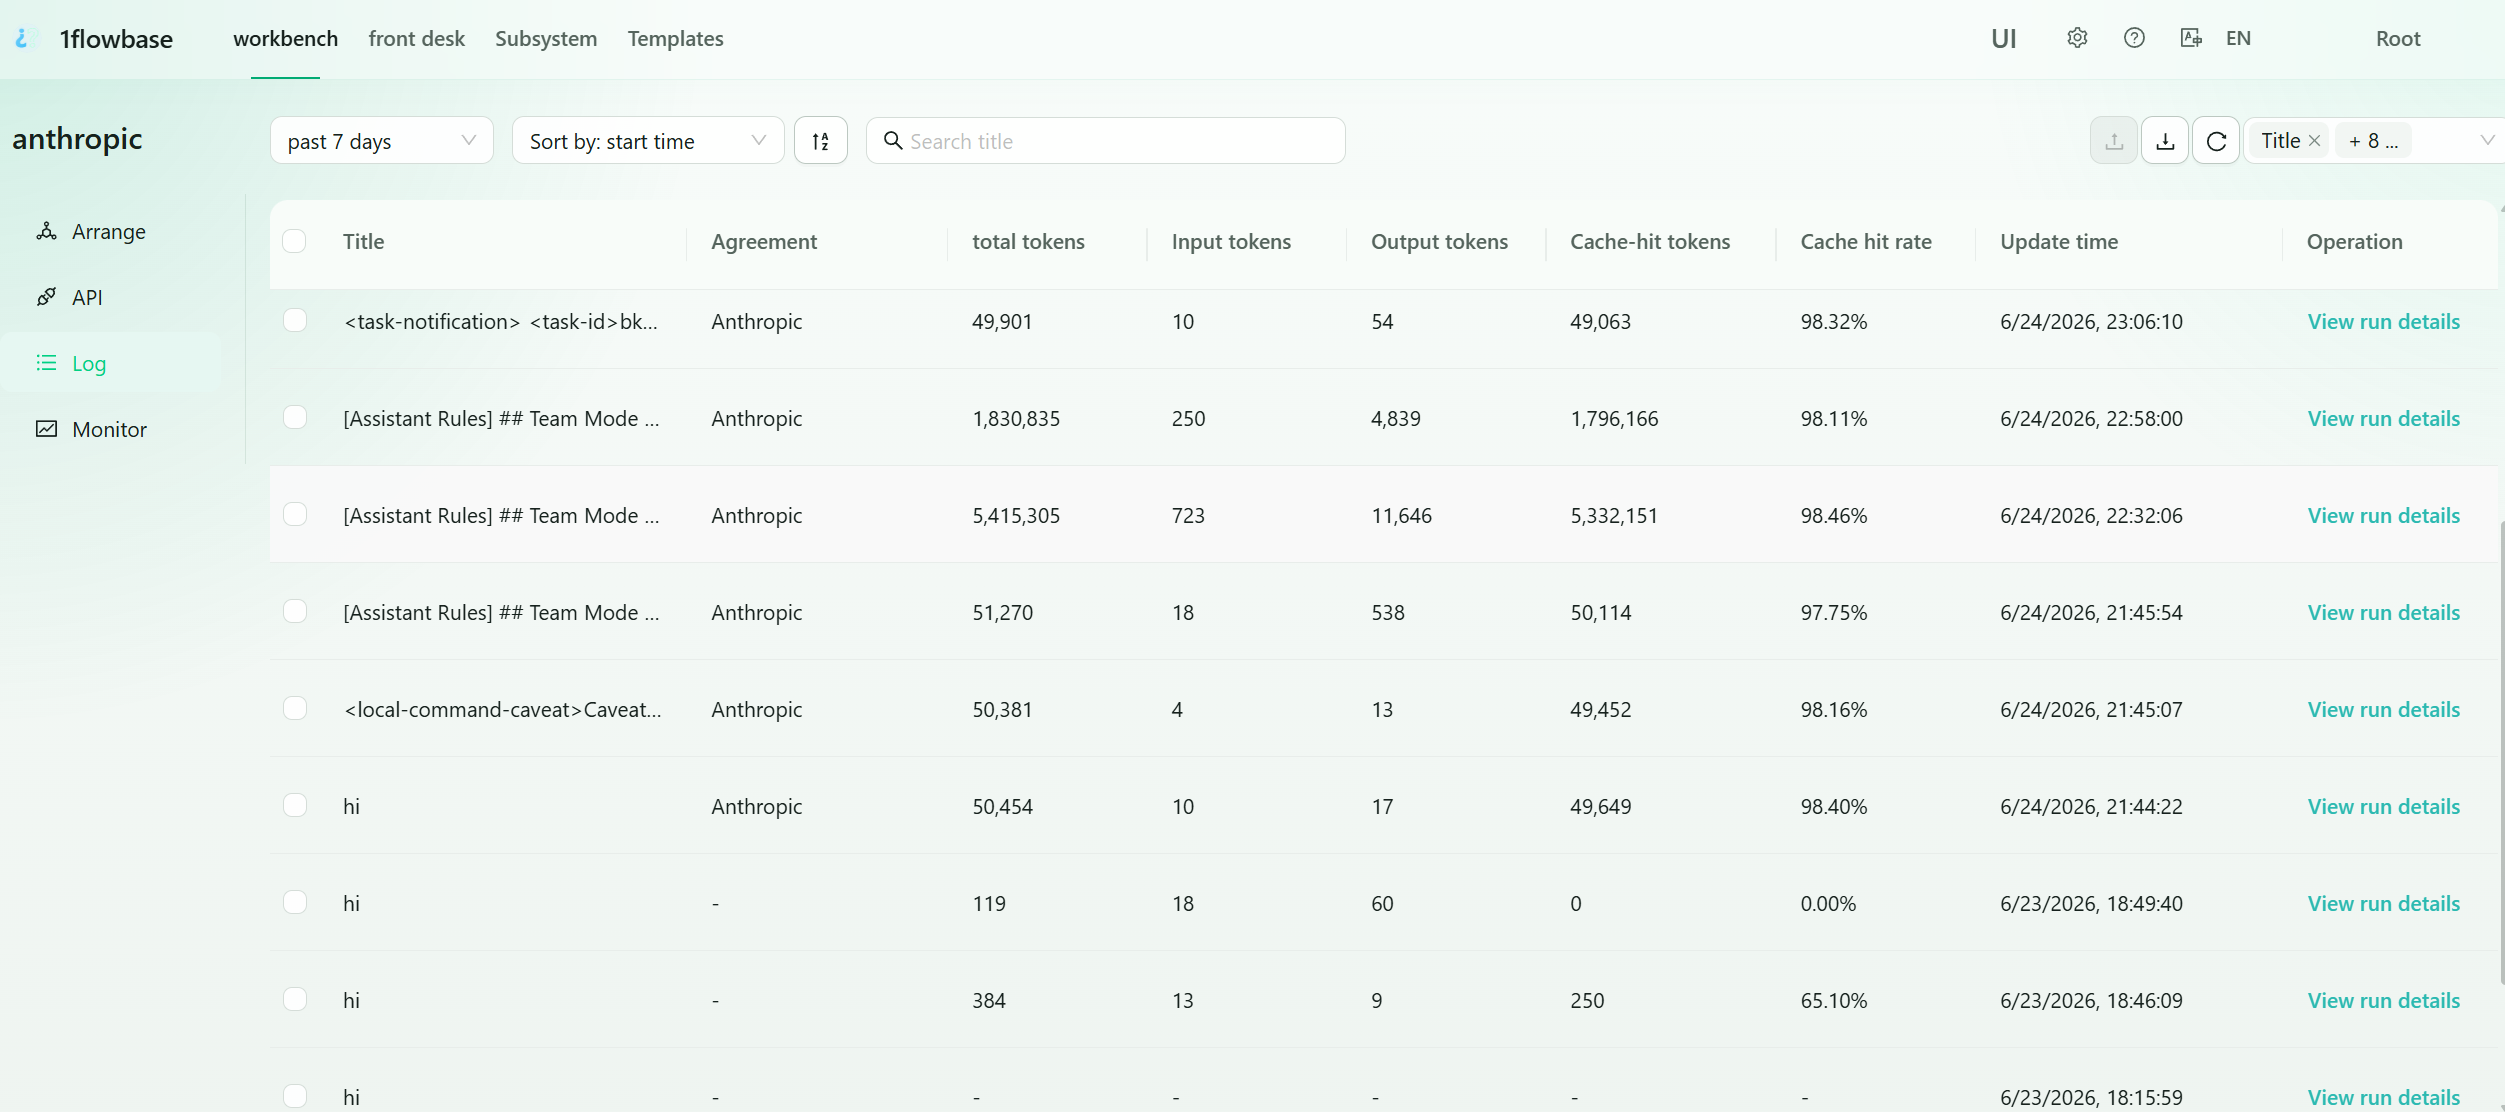
This is the fastest way to find abnormal runs.
For example:
One request may look small at the prompt level.
The run table may show millions of total tokens because most of the cost came from cache-hit context, routed work, or repeated agent steps.
The point is not only cost accounting. The table tells you which runs deserve inspection.
The monitor view shows aggregate cost shape
A Token BOM is useful at two levels:
- one run: what happened in this request
- many runs: what pattern is growing over time
The monitor dashboard shows total tokens, input tokens, output tokens, cache-hit tokens, new tokens, tool callbacks, protocol distribution, source distribution, and token trend.
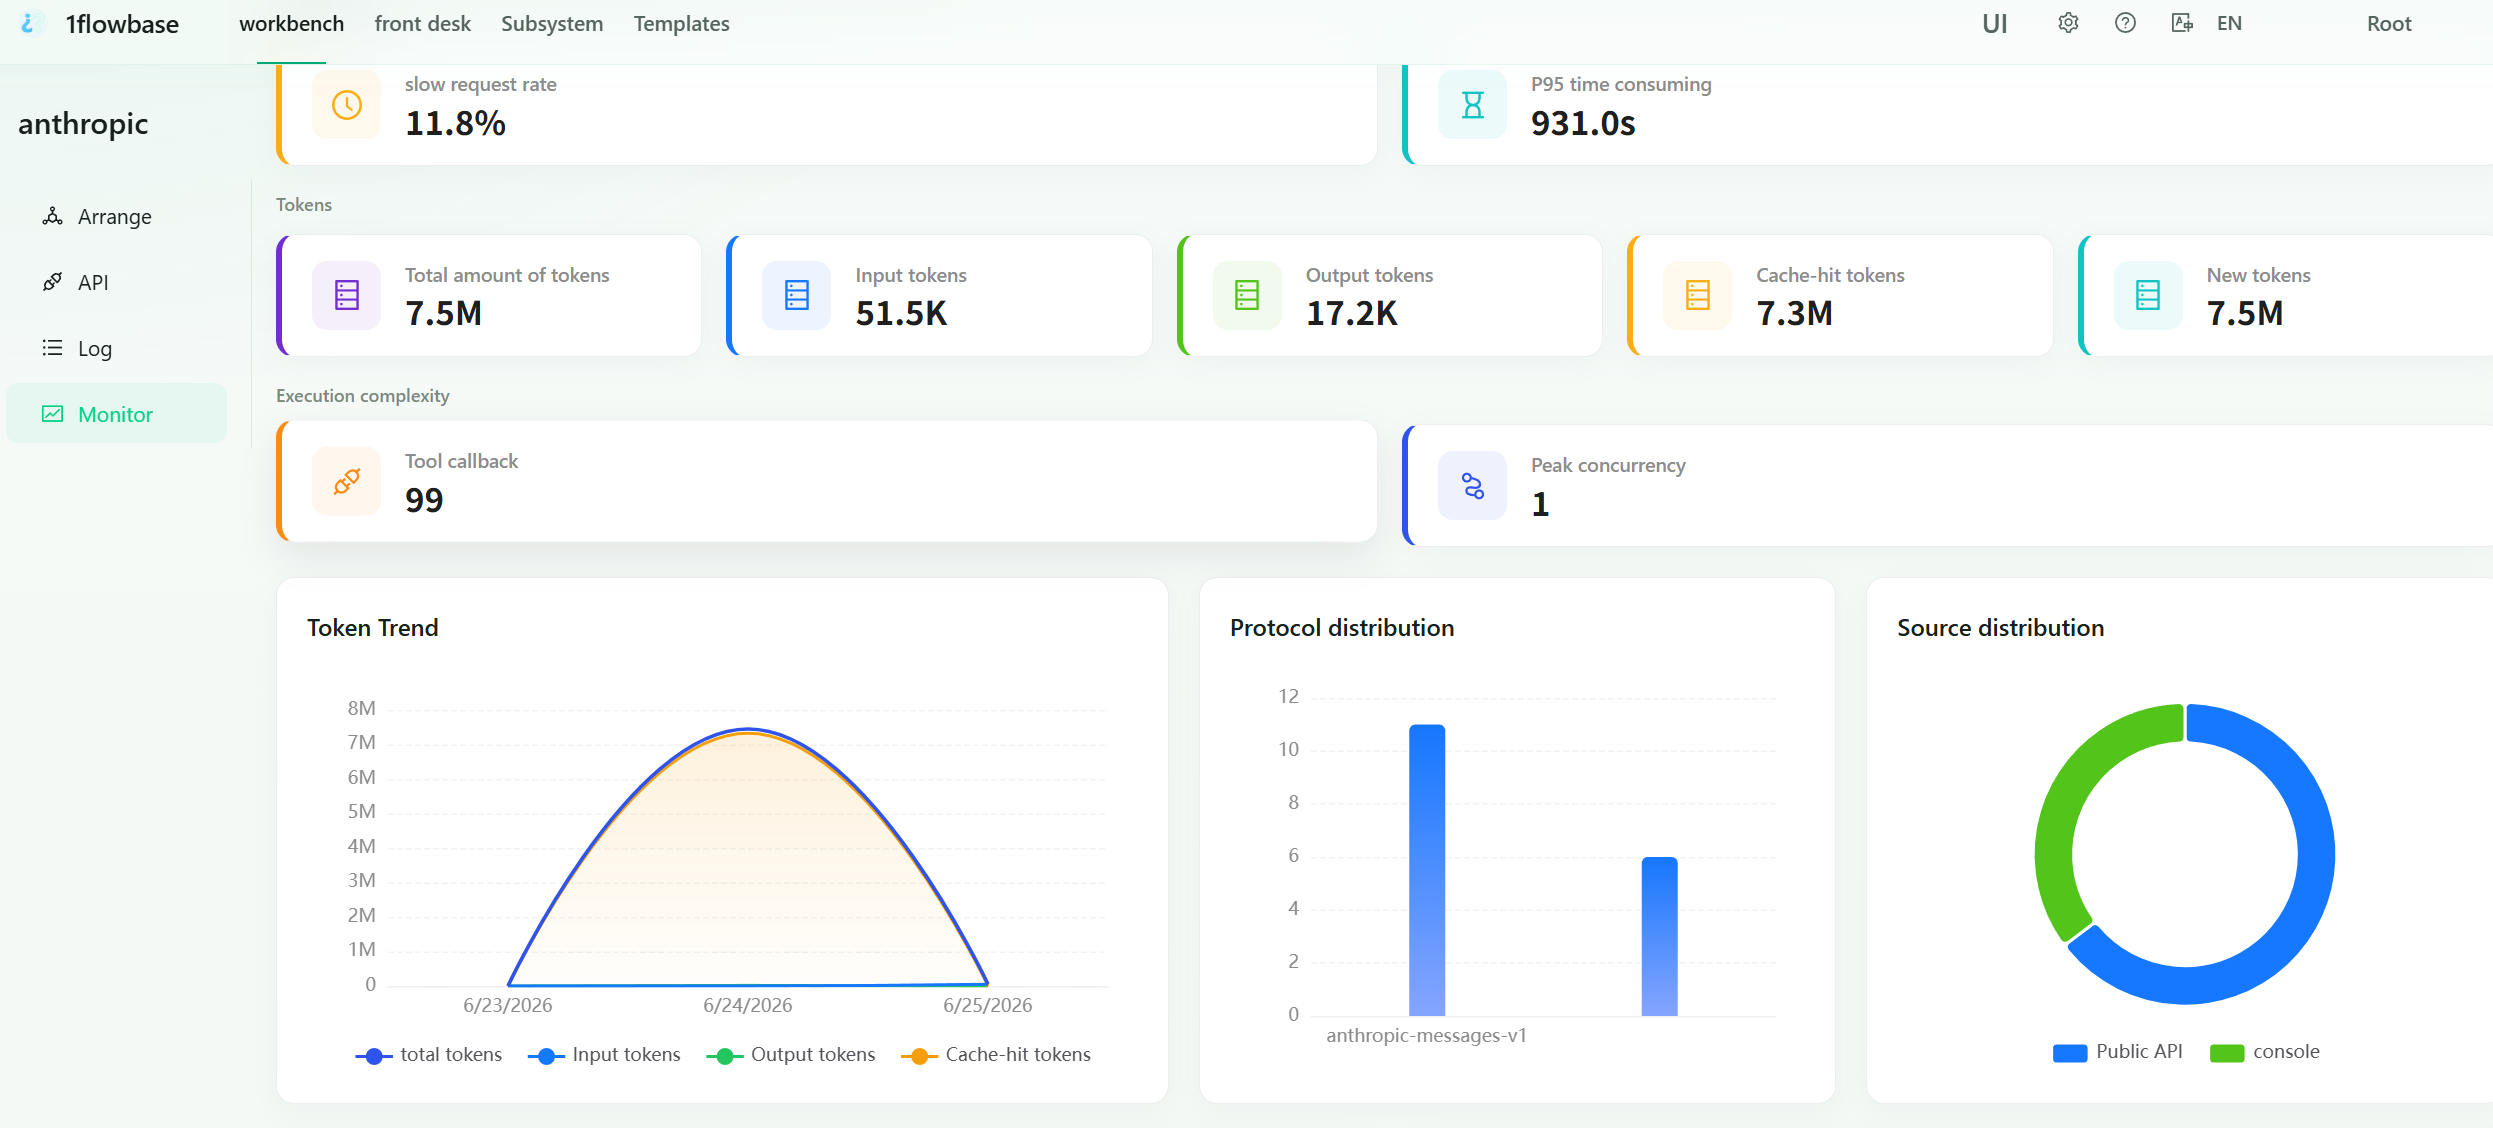
This helps answer:
Are most tokens coming from public API traffic or console usage?
Are cache-hit tokens dominating the workload?
Are tool callbacks increasing?
Which protocol is carrying the traffic?
Is one day or one endpoint causing the spike?
For an agent team, this is the difference between “Claude Code feels expensive” and “this route produced 7.5M total tokens, 7.3M cache-hit tokens, and 99 tool callbacks.”
The API endpoint keeps clients simple
1flowbase publishes workflows as common model APIs. The client can call a normal endpoint:
- OpenAI-compatible Chat Completions API
- OpenAI-compatible Responses API
- OpenAI-compatible Models API
- Claude-compatible Messages API
- Claude-compatible token counting API
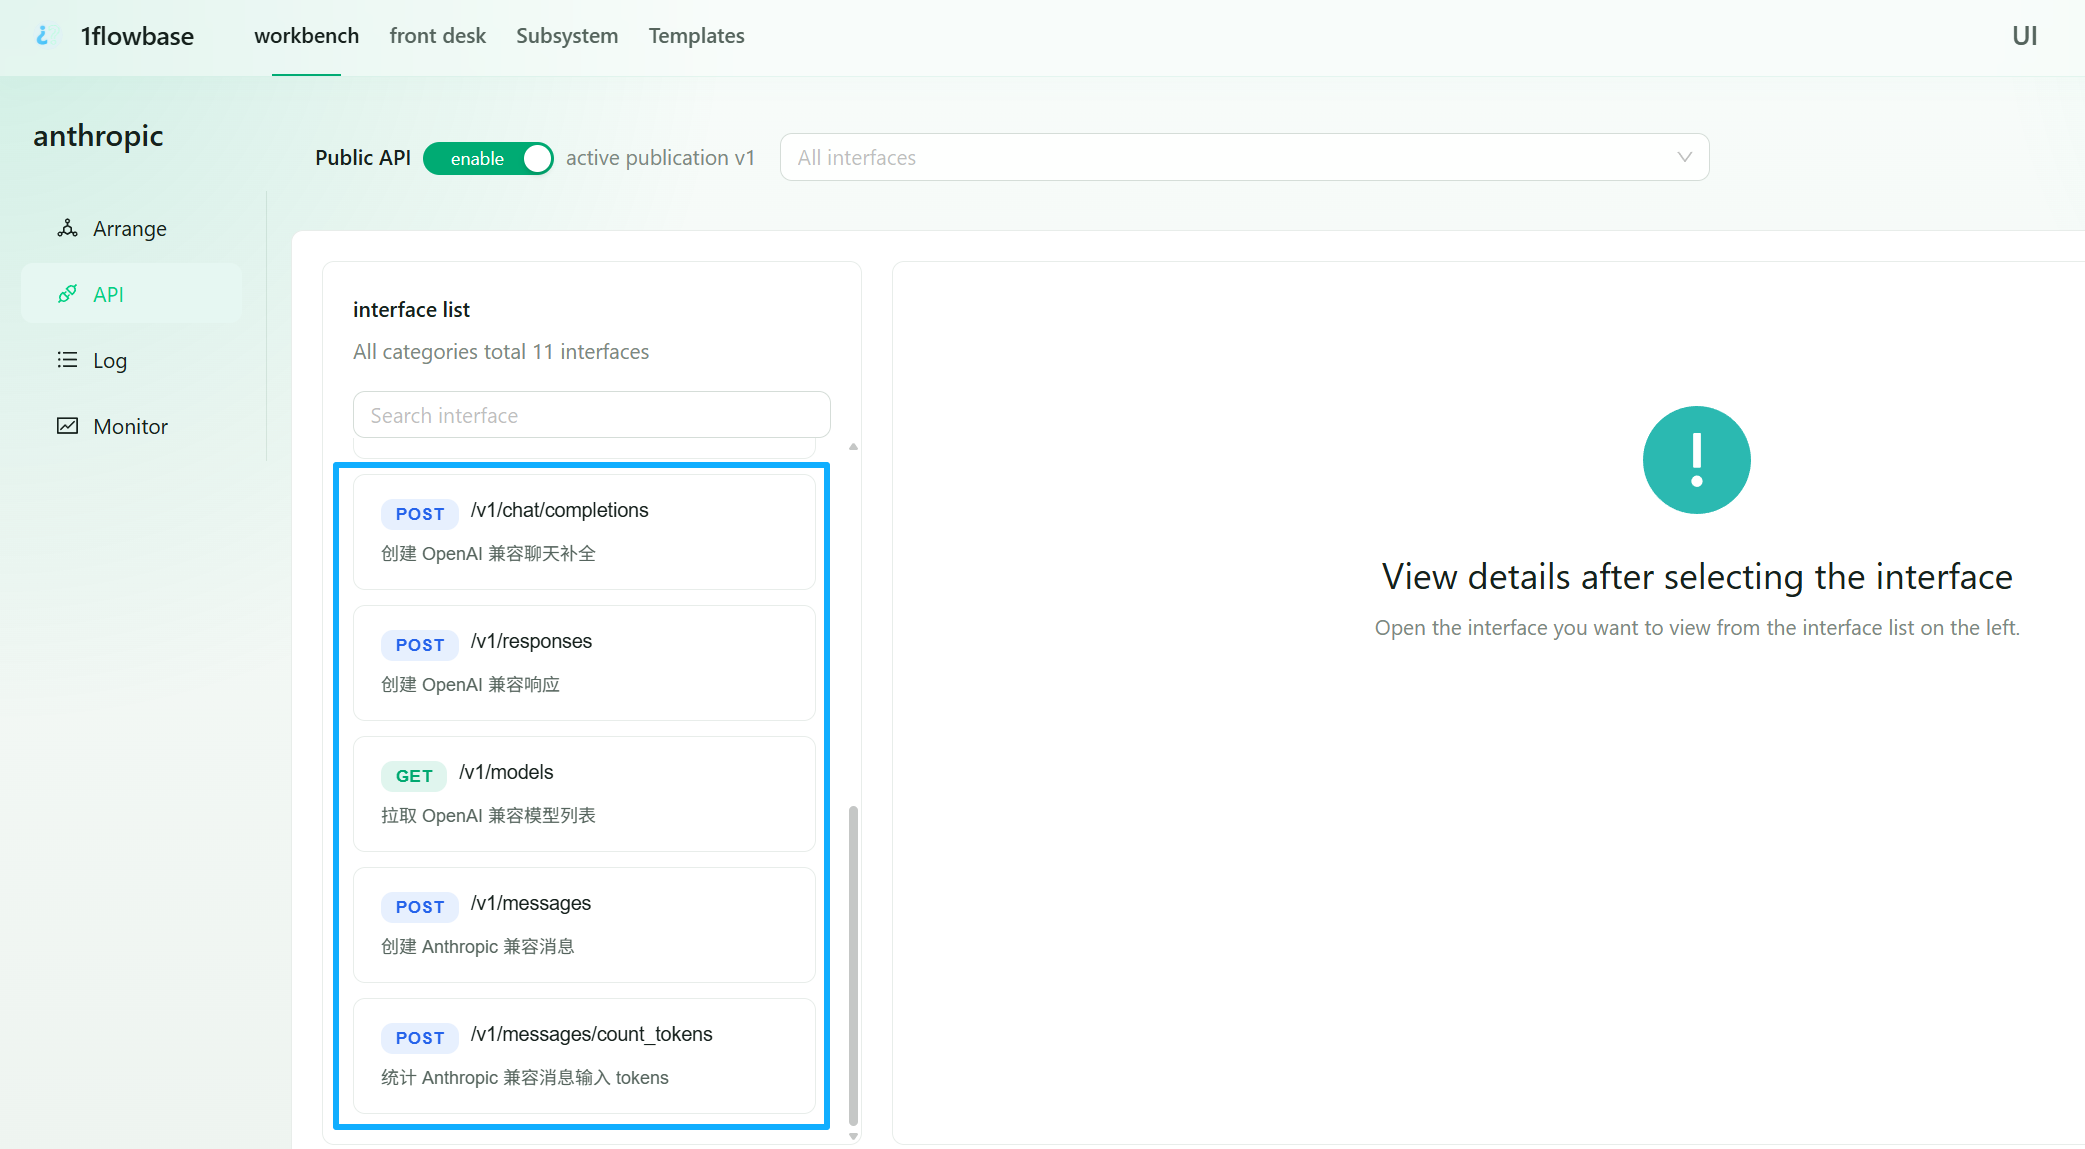
That means the client does not need to understand the internal workflow.
Claude Code / Codex / Cursor / SDK
  -> one 1flowbase virtual model endpoint
  -> workflow-backed model path
  -> observable run log
  -> Token BOM
This is different from a plain model router. A router chooses an upstream model. 1flowbase can expose a workflow as the model, then show what happened inside it.
The track view turns a run into an execution tree
Open a run and switch to the Track tab. You can inspect the work as nested steps, not as one opaque response.
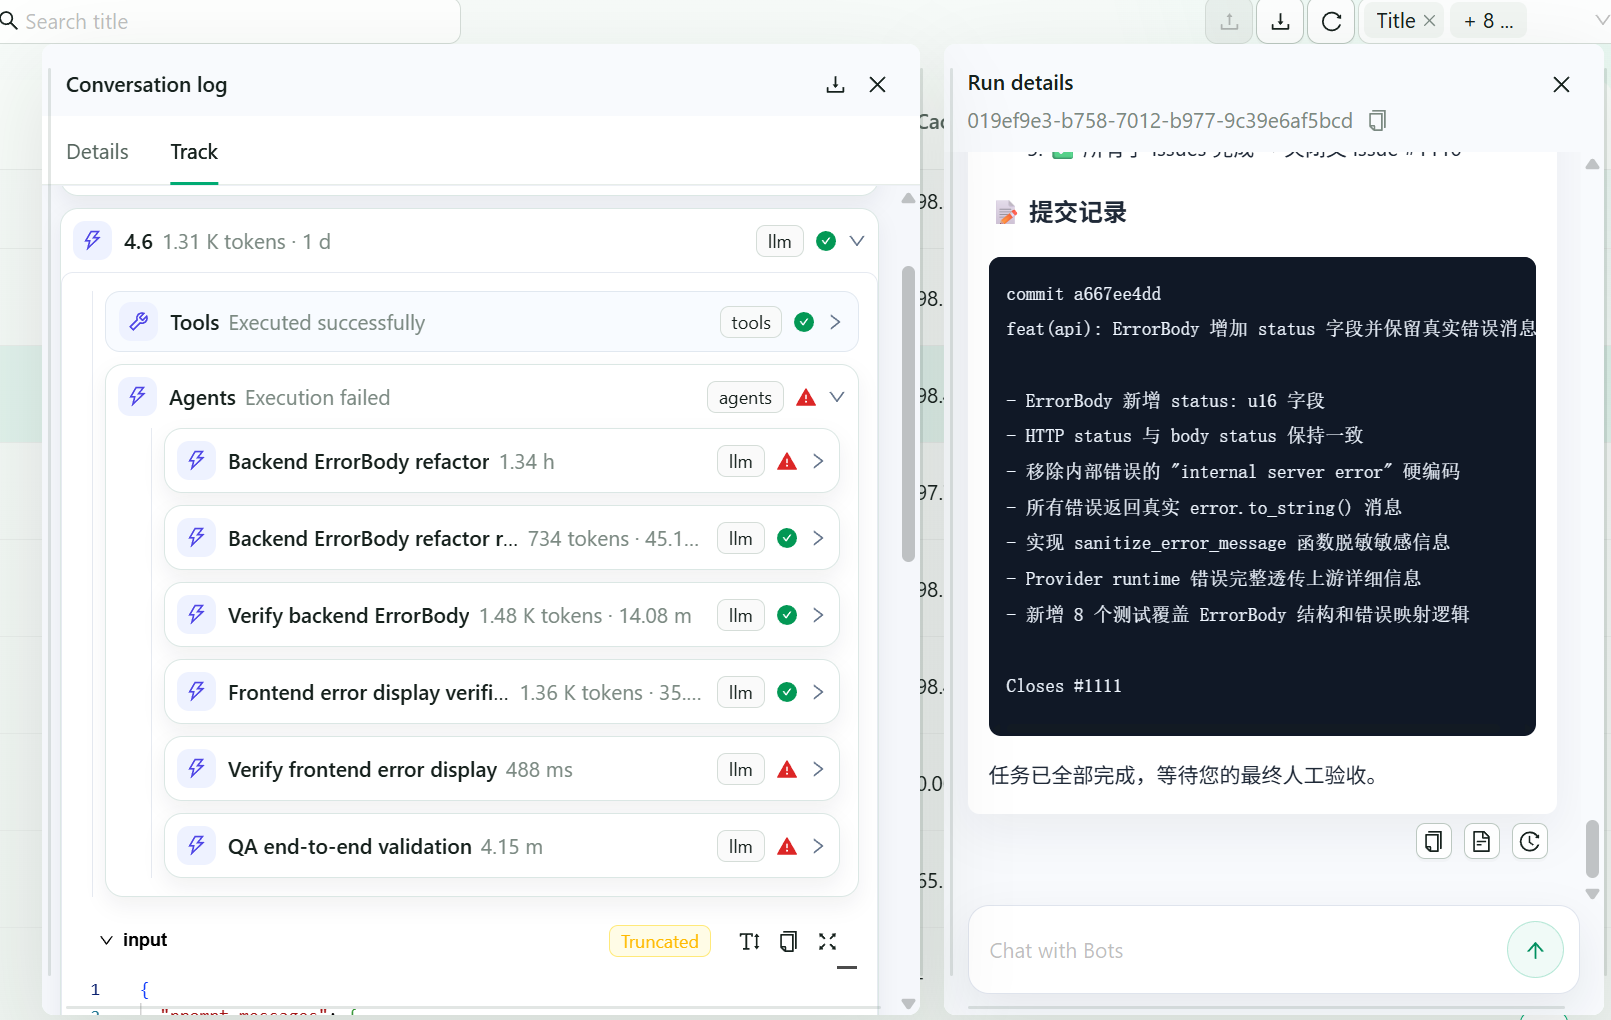
In the track view, a Token BOM becomes concrete:
- tool steps
- agent steps
- LLM calls
- success or failure state
- token count per step
- duration per step
- input and output payloads
- final run details
This matters when an agent looks like it “just answered” but actually delegated work, retried, or failed in the middle.
Smart routing makes routed work visible
Many agent teams want model routing for cost control. That is useful, but routing alone is not enough.
If your model is actually a workflow, you need to see the routed work too.
In 1flowbase, a mounted LLM tool can use Smart routing mode. The main model can delegate a subtask to a branch LLM. That branch LLM can use enabled external tools, then return the result to the main model as a tool result.
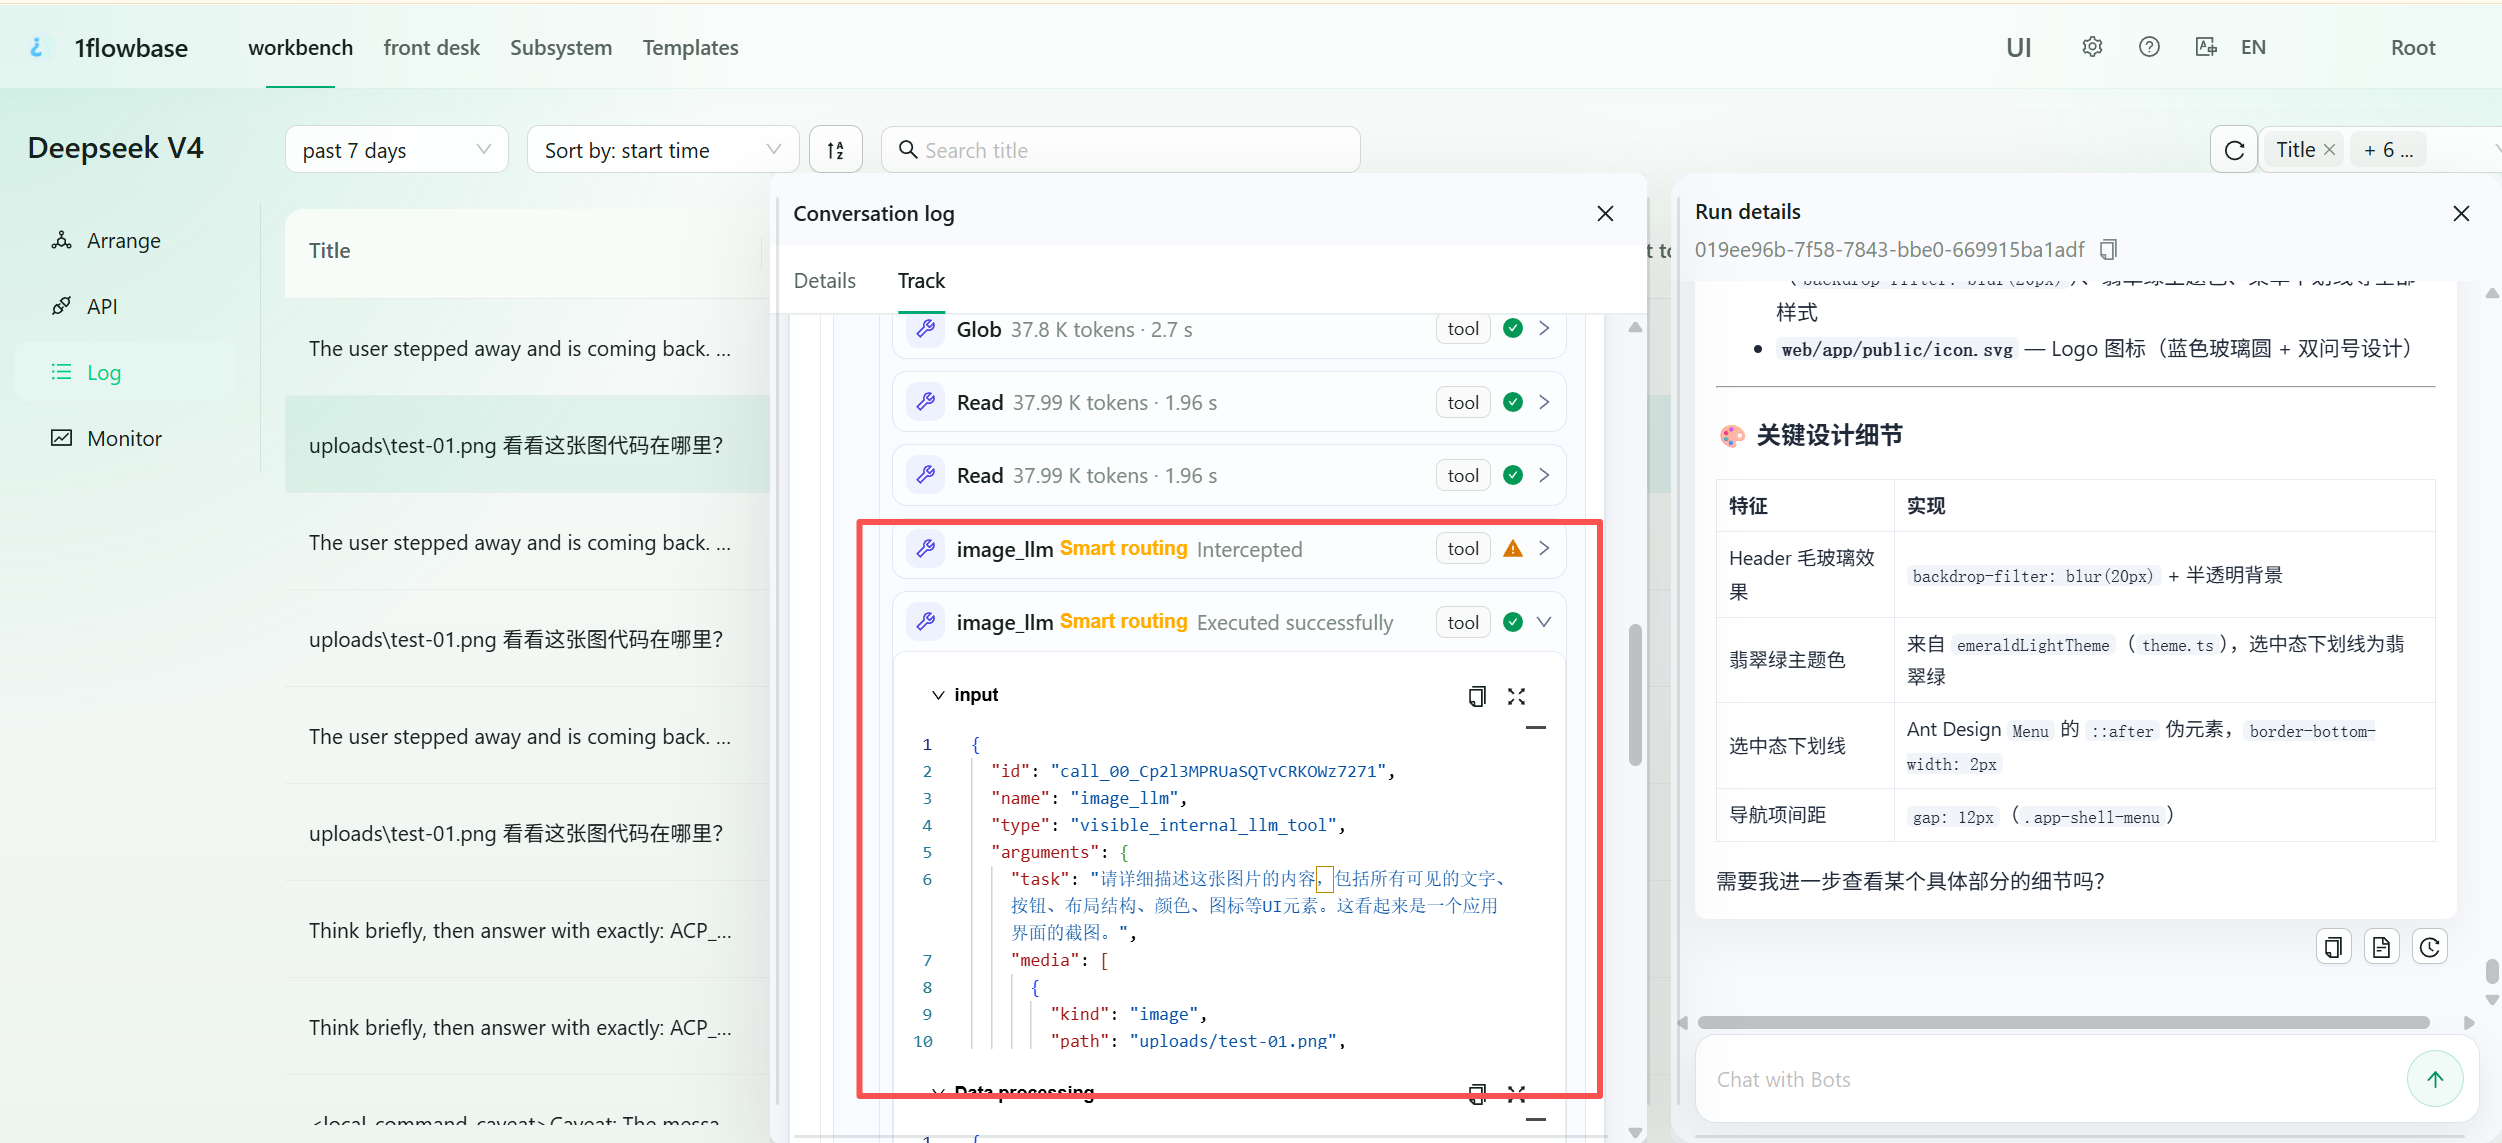
The log can show:
image_llm Smart routing Interceptedimage_llm Smart routing Executed successfully- tool input
- media references
- branch model result
- final answer
That makes the route auditable. You can see why the request left the main model path and what the routed model received.
Mounted tools define the BOM boundary
The mounted tool configuration defines when a branch model should be used and what it is allowed to do.
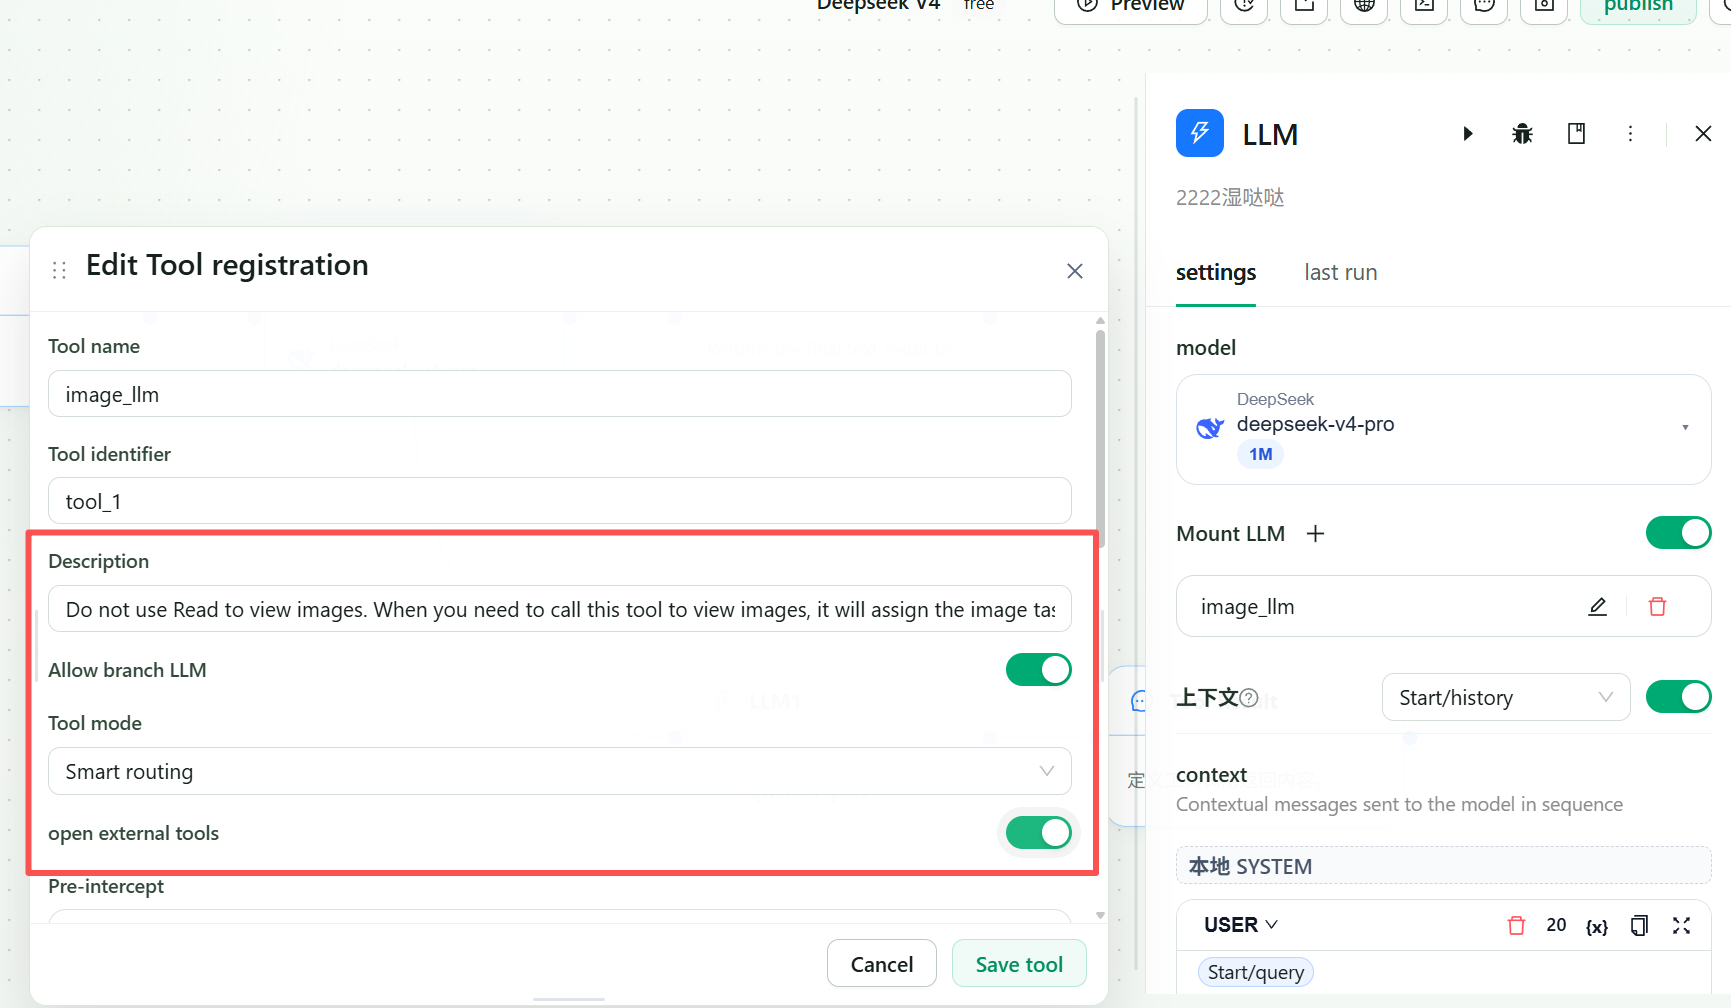
For example, a tool description can say:
Do not use Read to view images. When you need to view images, call this tool.Then the tool can be configured with:
- Allow branch LLM
- Smart routing mode
- open external tools
- a task-specific branch model
- controlled context and tool access
This is where cost control and safety become practical. You are not only saying “use a cheaper model.” You are defining which subtask is allowed to route, what context it sees, and which tools it may use.
A practical Token BOM schema
For each run, the useful fields are:
run_id
client
protocol
virtual_model
total_tokens
input_tokens
output_tokens
cache_hit_tokens
cache_hit_rate
new_tokens
tool_callback_count
latency
slow_request_rate
source
route_decisions
failed_steps
successful_steps
final_status
For each step, the useful fields are:
step_id
step_type
model_or_tool
input_tokens
output_tokens
cache_hit_tokens
latency
status
error
input_payload
output_payload
parent_step
You do not need all of this for every dashboard. But when an agent run becomes expensive or wrong, this is the shape of the evidence you want.
What to optimize after reading the BOM
Once the Token BOM is visible, you can make better routing and workflow decisions:
- Move simple extraction or formatting to a cheaper model.
- Keep complex coding or reasoning on a stronger model.
- Route image inspection to a multimodal branch model.
- Disable external tools for routes that do not need them.
- Add fallback only where provider failure is common.
- Fix prompts that cause repeated tool calls.
- Watch cache-hit tokens separately from new tokens.
- Investigate failed steps instead of blaming the final model.
This is the main difference:
Without a Token BOM:
  The agent was expensive.

With a Token BOM:
  This branch model used tools 99 times, most tokens were cache-hit context,
  the slow path was the routed image inspection, and the failed agent step
  happened before final synthesis.
When to use this pattern
Use a Token BOM when:
- Claude Code or another agent client is connected to a custom endpoint
- you route between multiple models
- you mount multimodal or tool-using branch LLMs
- you need cost and latency visibility per run
- you need to debug failed agent steps
- you want one client-facing model name but a richer internal workflow
If you only need a static proxy, a normal router may be enough. If your endpoint is a workflow, you need the workflow trace.
Search terms this guide covers
This guide is relevant if you are searching for:
Claude Code token cost
Claude Code token usage
Claude Code cost tracking
AI agent cost tracing
hidden token spend
workflow token breakdown
LLM routing cost attribution
agent trace token usage
cache-hit token cost
tool callback token cost
Try it with 1flowbase
1flowbase is an open-source AI gateway for local agent clients. It lets you publish workflow-backed virtual model endpoints and inspect model calls, node inputs and outputs, tool callbacks, tokens, latency, failures, and cost.
Repository: https://github.com/taichuy/1flowbase
Related guides:
- Smart LLM Routing for AI Agents
- Make GLM-5.2 See Images in Claude Code with 1flowbase
- Fusion-Style Workflows
If this helped you reason about agent cost or routing, star the repository and try publishing one workflow as a virtual model endpoint.